| |

Power View In Microsoft ExcelIn this modern world, where the data reigns is supreme, so the ability to transform out the raw information into the meaningful insights primarily opens out the door to the countless possibilities. Let us picture this: the respective Power View, is termed to be a game-changing data visualization tool that empowers users to breathe life into their data by making use of the interactive charts, graphs, maps, etc. Whether we are in Microsoft Excel, SharePoint, SQL Server, or Power BI, Power View acts as our key to unlocking the full potential of our data effectively. At its core, the respective Power View is primarily a technology that transcends the mundane representation of numbers. It is our passport to a vibrant landscape where data becomes more than just digits on a screen-it becomes a story waiting to be told as well. More often this article takes will takes on a journey into the realm of the Power View, unraveling how it revolutionizes the way we see and comprehend data across different platforms in an effective manner. Let us now imagine we are a seasoned data analyst or someone taking the first steps into the captivating world of the visualization of data. In both scenarios, Power View has something transformative to offer. It is not just a tool; it's a companion in our data-driven decision-making processes, enriching our understanding as well as the communication of insights. What makes Power View truly exceptional is its versatility. It does not confine us to one platform; instead, it seamlessly integrates into Microsoft Excel, SharePoint, SQL Server, as well as Power BI. This adaptability means we can wield the power of the Power View wherever our data resides respectively. And now we will be deep-diving to the center of the power view magic, and it is all about turning dry data into a visual spectacle. Imagine crafting dynamic charts that tell a story, graphs that unveil trends, and maps that bring geographical data to life effectively. Power View transforms the way we interact with the data, making the process not just insightful but downright enjoyable. Furthermore, this article primarily invites us to uncover the potential locked within our data. Whether we are a seasoned pro seeking new avenues of exploration or a novice eager to make data more than just a set of numbers, Power View is the guide on this exhilarating journey. Together, let us unveil the power of the Power View, where data becomes a canvas, and insights transform into a narrative that speaks to everyone, regardless of their level of expertise in the world of data. What is Power View in Microsoft Excel?The respective Power View in Microsoft Excel is primarily termed to be the data visualization tool that is effectively designed for the purpose of creating interactive reports as well as dashboards. With the help of the Power View one can easily simplify out the process of transforming the raw data into visual compelling presentations as well. It can be accessed with the help of the Microsoft Excel ribbon, which is present just under the "Insert" option. Power View enables users to import data from diverse sources, including Excel tables as well as external databases. The tool's strength lies in its user-friendly interface, which usually allows individuals to generate dynamic visualizations without extensive technical expertise. Users can effortlessly build charts, tables, matrices, and maps by just dragging as well as dropping fields onto the report canvas. Notably, the respective Power View emphasizes interactivity. Connected visualizations respond in real-time to user interactions, fostering a dynamic exploration of the data. This feature is complemented by the integration of the slicers-interactive filters enabling users to focus on specific data subsets as well. Moreover, the Power View reports can be enriched with text, images, as well as formatting options, thus enhancing their professional appearance. Sharing and collaboration are facilitated through Microsoft Excel workbooks, embedding Power View reports for seamless distribution. Furthermore, the tool basically supports export to various formats, like as PowerPoint, streamlining integration into presentations. Power View empowers Microsoft Excel users to create engaging as well as insightful visualizations, offering a user-friendly platform for dynamic data exploration and presentation, respectively. List out the advantages of using Power View in Microsoft Excel.We all knew that the respective Power View that is considered to be the integral component or the specific part of the Microsoft Excel, emerges as a dynamic and with a feature-rich tool, that offers a spectrum of the advantages and redefine the landscape of the visualization of the data and its analysis effectively. And in exploration of this, we usually delve into the core strengths of the Power View, elucidating its user-friendly interface, seamless integration with the Power Pivot, and also the support for the diverse data sources. 1. User-Friendly Interface: More often, at the forefront of its appeal, the respective Power View boasts an intuitive as well as the user-friendly interface. And gone are the days of the complex programming or the necessity for the advanced technical skills respectively. The drag-and-drop functionality empowers users to effortlessly create visually compelling reports as well as dashboards, fostering a more accessible approach to visualization of the data. 2. Integration with the Power Pivot: The symbiotic relationship between Power View and Power Pivot elevates the tool's capabilities to new heights. Not limited to visualizing data, this integration enables users to construct intricate data models, facilitating in-depth analysis. This synergy proves particularly invaluable when dealing with extensive datasets, providing a robust solution for users with complex analytical requirements as well. 3. Support for the Multiple Data Sources: More often, it was well known that flexibility is a hallmark of the Power View, evident in its seamless support for a myriad of data sources. Whether the data resides in Microsoft Excel tables, Power Pivot models, or external repositories like SQL Server and SharePoint lists, Power View effortlessly connects and visualizes diverse datasets. This adaptability ensures users can work with the data sources that are most pertinent to their analytical needs. 4. Interactive Exploration of the Data: Power View's interactive capabilities take center stage, allowing users to filter and slice data within the visualizations dynamically. This on-the-fly exploration of the specific data subsets occurs without altering the original dataset, enhancing the user experience and enabling a more responsive and personalized approach to the effective analysis of the data. 5. Export and Sharing Capabilities: The journey with the Power View extends beyond individual exploration. Reports crafted within Power View can be exported to popular formats such as PowerPoint, facilitating seamless sharing. In addition to this, the integration with SharePoint usually opens avenues for collaborative efforts, ensuring that insights derived from the Power View can be shared with a broader audience respectively. In essence, the respective Power View is not merely a tool, but it is a conduit for transforming the raw data into actionable insights. Its adaptability, integration capabilities, as well as user-friendly design, make it a cornerstone in the Microsoft BI stack. As we navigate the intricacies of the analysis of the data, Power View emerges as a beacon, illuminating the path to informed decision-making within the familiar confines of Microsoft Excel. List out the disadvantages of using Power View in Microsoft Excel.The various disadvantages of using Power View in Microsoft Excel are as follows:
Being aware of all these disadvantages helps respective users to assess whether Power View aligns with their specific requirements and whether alternative tools better suit their analytical as well as reporting needs. How one can easily enable the Power View under the Microsoft Excel?Now, for the purpose of enabling the Power View tool for the interactive reports as well as the dashboards, we are first required to enable it under Microsoft Excel, respectively. Step 1: First of all, we are required to navigate to the File menu, and then we will select the Options by just clicking on it. For this, we will be effectively following the below-mentioned steps: 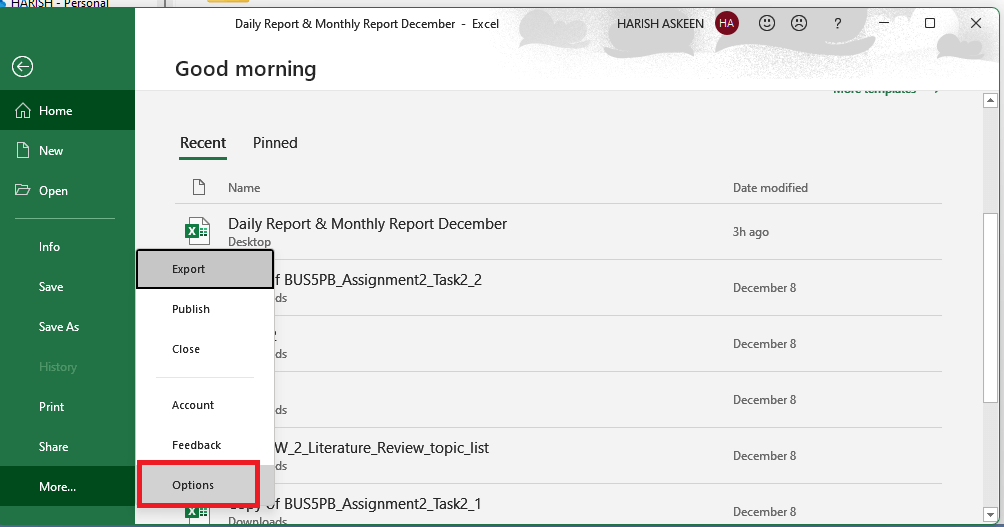
Step 2: Just after performing the above steps, an Excel Options window will appear on the screen pop with the various options as well. After that, we are required to click on the Add-ins option in order to get access of all the add-in options which are made available effectively. 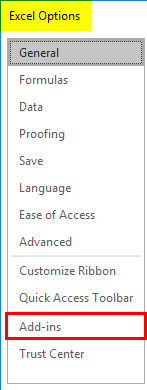
Step 3: Inside Add-ins, we can see an option known as Manage, which has all the Microsoft Excel add-ins as a dropdown. After that, we are required to select COM Add-ins inside the Manage option, and then we need to click on the Go button. 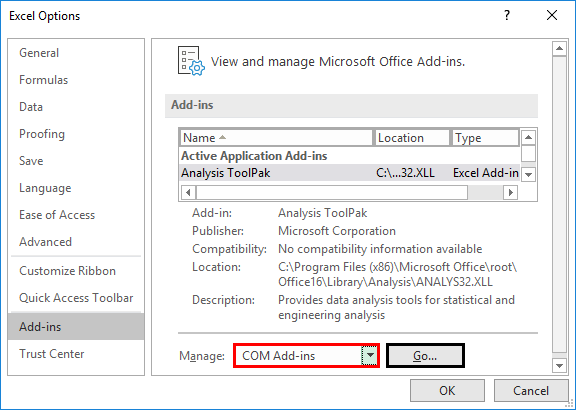
Step 4: Now, in this step, we will be selecting the Microsoft Power View for the Microsoft Excel option, which is available under the list of the COM Add-ins, and pressing the OK option effectively. 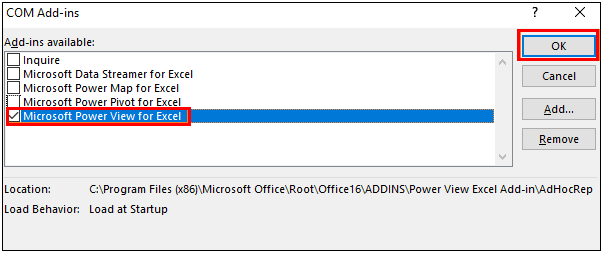
And despite of this, it will enable the Power View option in our Microsoft Excel respectively. 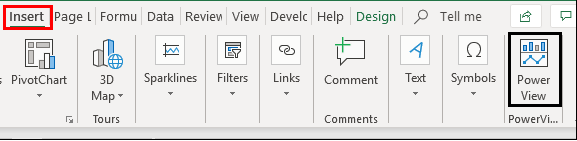
Example - Power View Usage in Microsoft ExcelLet us assume that we have sales data for the various customers from different countries. We would like a dashboard that is based upon this data present under Power View. And we are required to follow the below-mentioned steps respectively: 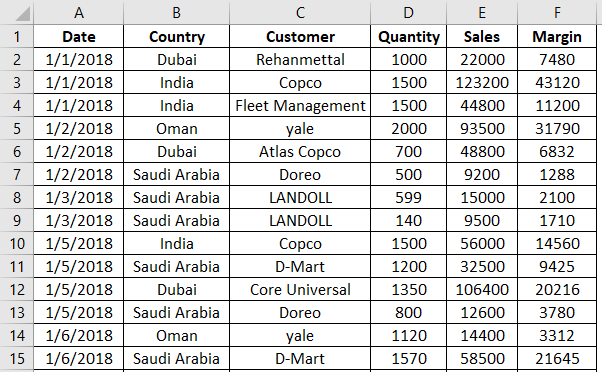
Step 1: First of all, we are required to insert a table for the selected data in an Excel sheet. Just after that, we need to press the CTRL+T shortcut with the help of our keyboard to efficiently insert the table under the given data, and then press the OK button. 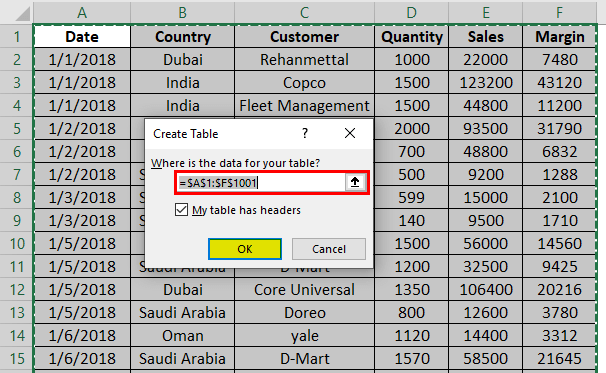
Just after performing the above steps, we will get the table as the one depicted in the below-mentioned screenshot: 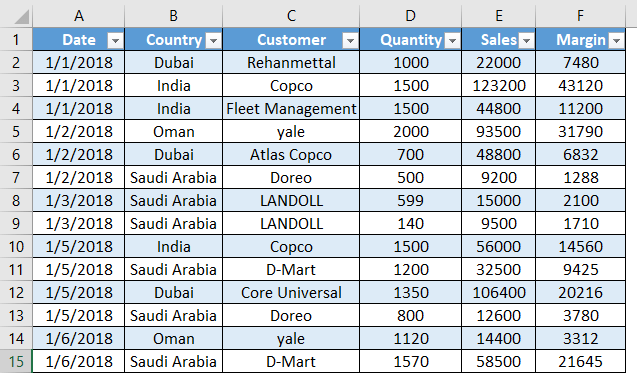
Step 2: Now, we will be navigating it toward the Insert tab option present just under the Excel ribbon, and just after that, we must need to click on the Power View option which is available at the end of the list. 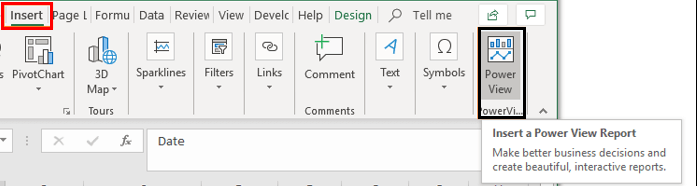
Step 3: When we will be clicking on the Power View option, it will then load it and will generate a Power View report within the same workbook as well. 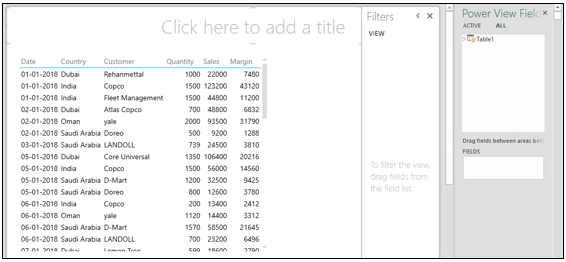
Moreover, this specific report layout has a table inside the main report template, and filters just besides that, and finally, the Power View Field list the same as that which we can see just inside PivotTables at the rightmost corner. Here, we can slice and dice the report data by just making use of the filters or a Power View Field list, respectively. Step 4: Here in this, we will be clicking on the Table dropdown inside Power View Fields and they will select the Country and the Margin Columns, respectively. Then, in that case, we can see the Quantity, Sales, and Margin columns sign. It is there because those are the columns that contain numeric data and present in them and can have a summation as well. 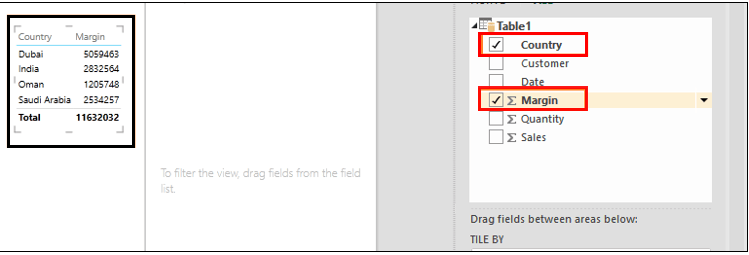
Step 5: Now, in this step, we will be adding a graph for this country-wise data. After that, navigate to the Design tab, which will appear at the top of the ribbon, and with this, we can see different design options that are present just under the Power View Report sheet. Out of those, one is Switch Visualization. More often, this option enables us to add graphs that are effectively present under the Power View Report. 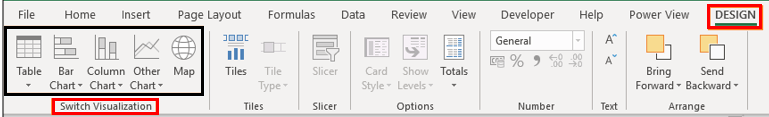
Step 6: Just after that, we will click on the other Chart dropdown, and then we will select the Pie option, which allows us to insert a pie chart for the country-wise data. 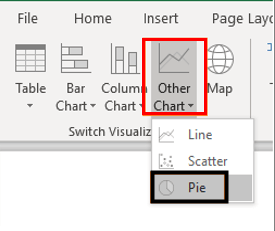
And our chart should look like the one depicted below in an effective manner: 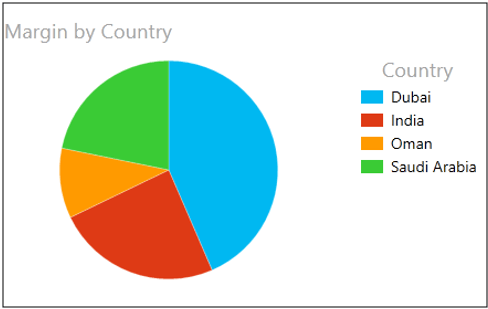
Step 7: In this step, we will be selecting the Customer column, Sales, as well as the Margin as the data. 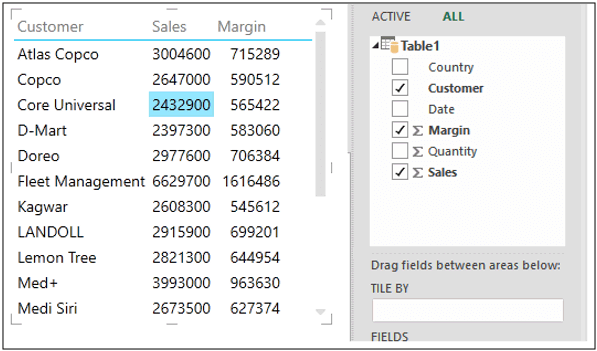
Step 8: Just after performing the above steps, we will be navigating out to the Design tab again, and then we will need to select the Clustered Bar option, which is present just under the Bar Chart dropdown inside the Switch Visualization menu in an effective manner. 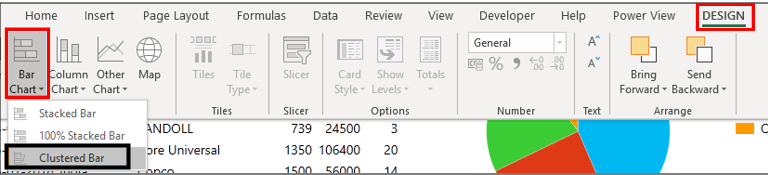
This option will enable us to visualize out the Sales and Margin for all customers in a single chart. See the screenshot below: 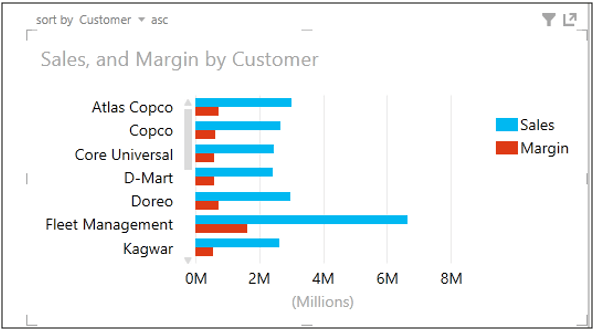
This graph allows us to check the key customers regarding sales as well as the margin amount. We have a scroll bar to scroll down until the last Customer. Also, we can sort the chart data by Customer, Sales, or Margin. Step 9: Follow down similar steps; however, we will now run the chart option for the Customer as well as the Quantity. After that, we will be selecting those two columns present just under the Power View Fields. 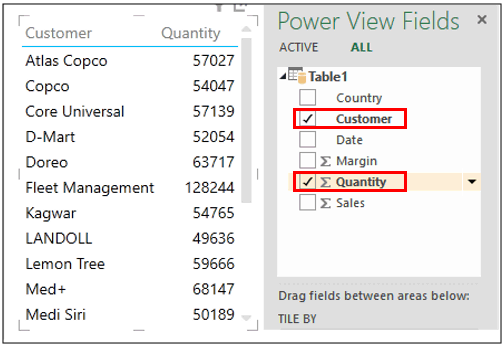
Step 10: And just after that, we will be following the same procedure as followed in step 8 in order to see the bar chart of the customer-wise Quantity sold as well. 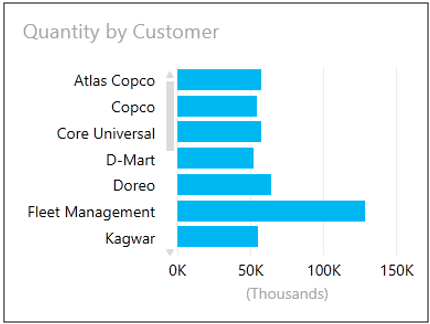
More often, this particular graph will help us to visualize to which customers we have sold most of the item and the quantities to. Step 11: So with the above procedure our report is complete. And now we are required to add the title to this report as "Sales Comparison with Different Parameters." And here we are ready with the final Layout of our Power View Report. 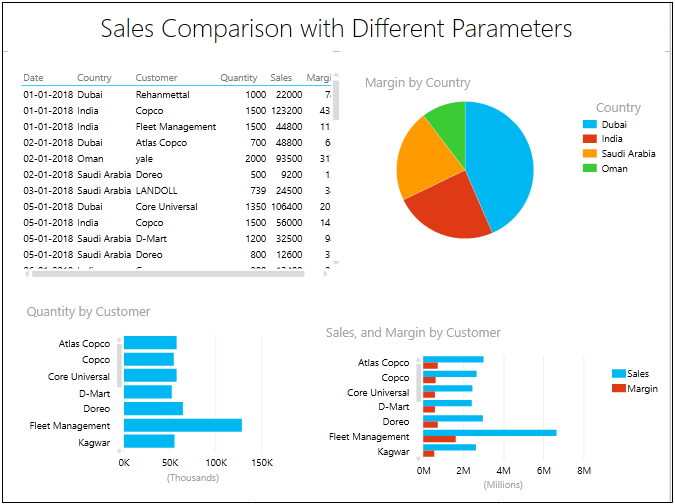
What are the important points that need to be remembered by an individual?The important points that need to be remembered by an individual while working with the Power View in Microsoft Excel are as follows:
Next TopicChebychev's Inequality in Excel
|
 For Videos Join Our Youtube Channel: Join Now
Feedback
- Send your Feedback to [email protected]
Help Others, Please Share


