| |

Mode Definition in StatisticsThe statistical mode, a measure of central tendency, represents a dataset's most frequent value or observation. The value that appears the most frequently in a data set is called the mode. A descriptive statistic called the mode is frequently used to describe a dataset's most prevalent feature. When values cannot be averaged or arranged, and the scale of the data is nominal or categorical, the mode is particularly helpful. To provide a more thorough picture of the dataset, the mode can also be used in conjunction with other measures of central tendency, such as the mean and median. 
Understanding the Concept of ModeThe most typical or frequent observation or value in a dataset is represented by the statistical concept known as the mode. The mode is a central tendency metric used to identify the data's geographic centre along with the mean and median. The mode is helpful when the dataset's values are nominal or categorical, so they can't be easily measured or arranged. The mode, for instance, can be used to define the most prevalent colour in a group of objects, the most prevalent animal in a zoo, or the most prevalent survey response. Finding the value that appears the most frequently in the dataset is necessary to determine the mode. The dataset is said to have several modes if more than one number has the highest frequency. The mode is a straightforward and understandable measure of central tendency that is simple to compute. It is crucial to remember that the mode could not indicate the complete dataset and that outliers or high values could impact it. To provide a full picture of the data, the mode should be used in conjunction with other measures of central tendency, such as the mean and median. The Mode Calculation ProcessTo calculate the mode, you must determine the value or values that appear most frequently in a dataset. The steps to determine the mode are as follows:
The dataset is considered to have no mode if no value appears more frequently than any other. The dataset contains several modes if two or more values have the same maximum frequency. Here is an illustration of how to determine the mode: Dataset: 2, 3, 4, 4, 5, 6, 6, 6, 7, 8 Step 1: Sort the information into ascending or descending order: 2, 3, 4, 4, 5, 6, 6, 6, 7, 8 Step 2: Determine how frequently each value appears in the dataset.
Step 3: Determine the value or values that are most often. The number 6 appears three times more than any other number in this instance. Consequently, the dataset's mode is 6. Keep in mind that there is only one mode in this example. However, a dataset may have many modes if two or more values have the same greatest frequency. Types of ModesA dataset's mode can be determined in one of three ways: 1. Unimodal A dataset containing just one mode is said to have a unimodal distribution. This indicates that one value in the dataset appears more frequently than any other value, according to the data. 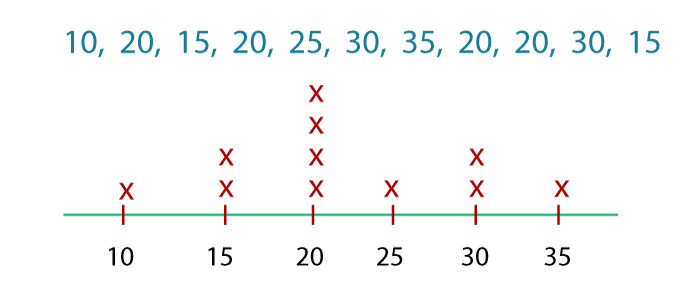
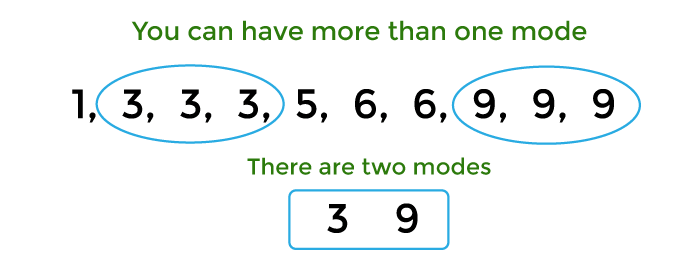
2. Bimodal A dataset with two modes is said to have a bimodal distribution. This indicates that two dataset variables share the highest frequency of occurrence. 3. Multimodal A dataset with three or more modes is said to have a multimodal distribution. This indicates that the dataset has three or more values that have the same highest frequency. For instance, suppose we have the dataset shown below: 5, 6, 7, 7, 8, 9, 9, 9, 10, 10, 10 In this instance, the number 9 and the number 10 each appear three times. As a result, the dataset is bimodal and contains two modes. Another illustration: 3, 4, 4, 5, 6, 6, 7, 7, 7, 8, 9, 9, 9 In this instance, the numbers 7 and 9 appear thrice, while all other numbers only appear once or twice. As a result, the dataset is bimodal and contains two modes, 7 and 9. Benefits and Drawbacks of Using ModeThe following benefits of utilizing mode in statistical analysis: 1. Simple and Easy to Calculate The mode is a central tendency metric that does not require complex mathematical calculations. 2. Applicable to Categorical Data Categorical data cannot be measured numerically, yet the mode applies to this data type. The mode, for instance, can be used to identify the survey's most popular colour, animal, or response option. 3. Resistant to Outliers The mode is not influenced by outliers, which are unique numbers that might skew other measures of central tendencies, such as the mean. DrawbacksHowever, utilizing mode has a few drawbacks as well: 1. Limited Data The mode only offers data on the most overall value in a dataset, which could not accurately reflect the whole dataset. It does not offer data about the distribution or variability of the data. 2. Ambiguity In datasets with several modes or datasets with a high level of variability, the mode can be ambiguous or deceptive. Other measures of central tendency, like the mean or median, may offer a more realistic depiction of the data under such circumstances. 3. Not Suitable for Continuous Data The model is inappropriate for continuous data, which are measurements that can be made on a numerical scale. This is so because the mode may not be a reliable indicator of central tendency because it is sensitive to small changes in the data. In conclusion, the mode is a helpful and straightforward indicator of central tendency, particularly for categorical data. To provide a more thorough picture of the dataset, it should be used with other measures of central tendency, such as the mean and median. Using Mode in Data AnalysisThe mode is a useful indicator of central tendency that can be applied to data analysis in the following circumstances: 1. Categorical Data Working with categorical data, such as nominal data, uses the mode very well. The model may be used to determine the most popular category or response. 2. Skewed Data The mode may best estimate the central tendency for skewed data since it is less sensitive to outliers than the mean. The model may better illustrate the "typical" value than the mean or median when the data distribution is significantly skewed. 3. Bimodal or Multimodal Distributions When two or more modes exist in a dataset, the model can pinpoint the values present their most frequently. The data distribution can be better understood, and any underlying patterns or trends can be found using this information. 4. Quick Comparison When only a tiny sample size or a handful of variables are of interest, the mode can be a quick and easy approach to compare datasets. Remembering that the mode may not necessarily be the best indicator of central tendency. The mean or median may offer a more realistic depiction of the data in circumstances where the data is continuous or highly variable. To provide a more thorough knowledge of the dataset, combining the mode with other measures of central tendency is advised. Mode, Mean, and MedianThe type of data and the research issue will determine which central tendency measure is used. Following are some general rules for selecting the mode, mean, or median: 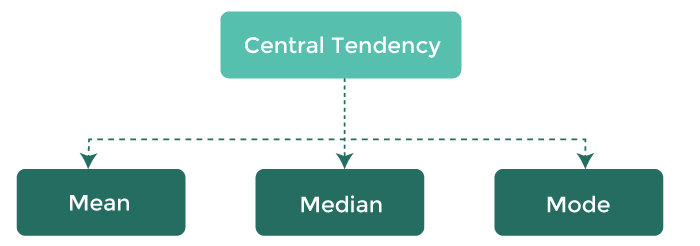
1. ModeThe mode is the best indicator of central tendency for nominal or categorical data for nominal or categorical data. The researcher can use it to find the most frequent value in a dataset or for skewed data. The mode, however, does not account for the size or variability of the data. 2. MedianWhen dealing with ordinal data, extreme values, or outliers in the dataset, the median is the best indicator of central tendency. Additionally, because extreme values have less impact than the mean, it is helpful when the dataset is heavily skewed. The median, however, does not account for the size of the data. 3. MeanFor interval or ratio data, the mean is the best indicator of central tendency because it accounts for the size and variability of the data. Additionally, it is helpful when the researcher has to determine the average value of the dataset or when dealing with regularly distributed data. When the dataset is skewed or contains outliers, the mean may not be a useful indicator of central tendency because it is so sensitive to extreme values. In conclusion, the type of data and the study topic determine the measure of central tendency to be used. To better understand the dataset, it is frequently helpful to compute many measures of central tendency and compare them. Mode in Frequency DistributionsThe value that occurs with the highest frequency, or the distribution's peak, is the mode in a frequency distribution. You can use the steps listed below to determine the mode in a frequency distribution:
There will be multiple values with the greatest frequency if the frequency distribution contains more than one mode (e.g., bimodal, trimodal, or multimodal). The frequency distribution in this instance is referred to as "multimodal," and all modes should be reported. 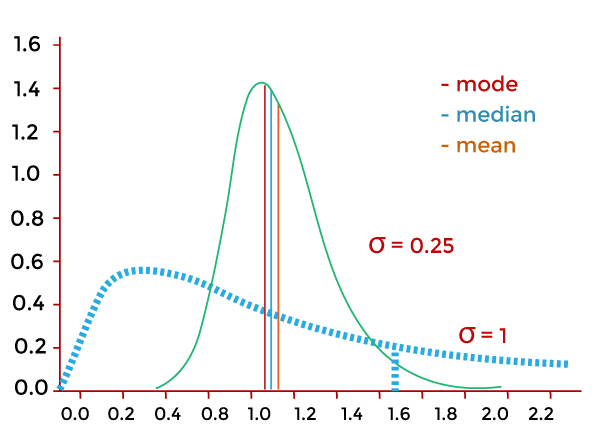
When a dataset's distribution is skewed or contains outliers, the mode can be particularly helpful in defining the dataset's central tendency. It is crucial to remember that the mode does not reveal the variability or distribution of the data but it rather merely reveals the dataset's overall value. To obtain a more thorough picture of the dataset, it is frequently helpful to compute additional descriptive statistics in addition to the mode, such as the mean and standard deviation. Mode in Descriptive StatisticsThe mode is a measure of central tendency used in descriptive statistics that depict the dataset value that occurs the most frequently. Simply identifying the value that appears most frequently will allow you to determine the mode in a dataset. When a dataset's central tendency is categorical or discrete, the mode might help define it. You could be interested in knowing the average test score if, for instance, you have a dataset of test results ranging from 0 to 100. The method can offer this information. It's vital to remember that not all datasets will lend themselves to the mode as the best indicator of central tendency. The mean or median better depict the major trend when the data is continuous or highly variable. It is frequently helpful to calculate other descriptive statistics, like the standard deviation or range, in conjunction with the mode to acquire a complete view of the dataset because the mode does not account for the magnitude or spread of the data. Mode in Inferential StatisticsThe mode can be used in inferential statistics to measure the central tendency to extrapolate population parameters from a sample. The mode, however, is less frequently employed in inferential statistics than the mean or median since it offers less insight into the data's distribution than those two variables do. When working with categorical data, such as the outcomes of a survey or opinion poll, the mode may be employed in inferential statistics. In this situation, the mode can be used to calculate the percentage of the population that shares a specific trait or viewpoint. Remembering that the mode may not always precisely reflect the population parameter is crucial, so care should be taken when using it in inferential statistics. Depending on the type of data and the study objective, other measures of central tendency, like the mean or median, might be more appropriate. When utilizing the mode in inferential statistics, it is also crucial to take the sample size and sampling technique into account because these elements may impact the estimations precision. Features of ModeThe mode is a measure of central tendency with the following characteristics:
It is crucial to remember that even if the mode has limitations and occasionally does not give a complete picture of the data, it can be useful in some circumstances. To provide a more thorough understanding of the data, it is frequently used with other measures of central tendency, such as the mean and median.
Next TopicRDBMS Definition
|
 For Videos Join Our Youtube Channel: Join Now
Feedback
- Send your Feedback to [email protected]
Help Others, Please Share


